Clustering Models
Clustering is an unsupervised learning method used in machine learning. Unsupervised means there is not a target in mind. Rather, we are simply noticing the patterns in the data. In the following examples, I use K-means clustering, which makes centers in the data and assigns all data points to the closest center. The data points are then classified based on their center. I use 2, 3, and 4 cluster centers to see how well the data is centered around these cluster centers.
Two Cluster Centers
This is the full data set based on 2 clusters in a table form.
TwoClusters<-kmeans(trainTransformed[,-5],centers=2)
Clusterdata<-trainTransformed
Clusterdata$Cluster<-as.factor(TwoClusters$cluster)
knitr::kable(Clusterdata)%>%
  kableExtra::kable_styling("striped")%>%
  kableExtra::scroll_box(width = "100%",height="300px")
| Sepal.Length | Sepal.Width | Petal.Length | Petal.Width | Species | Cluster | |
|---|---|---|---|---|---|---|
| 1 | -0.9564672 | 0.9771265 | -1.3544131 | -1.3132658 | setosa | 1 |
| 4 | -1.6037007 | 0.0955086 | -1.2964772 | -1.3132658 | setosa | 1 |
| 5 | -1.0859139 | 1.1975310 | -1.3544131 | -1.3132658 | setosa | 1 |
| 6 | -0.5681271 | 1.8587444 | -1.1806053 | -1.0485537 | setosa | 1 |
| 8 | -1.0859139 | 0.7567220 | -1.2964772 | -1.3132658 | setosa | 1 |
| 9 | -1.8625941 | -0.3453004 | -1.3544131 | -1.3132658 | setosa | 1 |
| 10 | -1.2153606 | 0.0955086 | -1.2964772 | -1.4456218 | setosa | 1 |
| 11 | -0.5681271 | 1.4179355 | -1.2964772 | -1.3132658 | setosa | 1 |
| 12 | -1.3448073 | 0.7567220 | -1.2385412 | -1.3132658 | setosa | 1 |
| 15 | -0.0503404 | 2.0791489 | -1.4702849 | -1.3132658 | setosa | 1 |
| 17 | -0.5681271 | 1.8587444 | -1.4123490 | -1.0485537 | setosa | 1 |
| 18 | -0.9564672 | 0.9771265 | -1.3544131 | -1.1809098 | setosa | 1 |
| 19 | -0.1797871 | 1.6383400 | -1.1806053 | -1.1809098 | setosa | 1 |
| 20 | -0.9564672 | 1.6383400 | -1.2964772 | -1.1809098 | setosa | 1 |
| 21 | -0.5681271 | 0.7567220 | -1.1806053 | -1.3132658 | setosa | 1 |
| 22 | -0.9564672 | 1.4179355 | -1.2964772 | -1.0485537 | setosa | 1 |
| 26 | -1.0859139 | -0.1248959 | -1.2385412 | -1.3132658 | setosa | 1 |
| 28 | -0.8270205 | 0.9771265 | -1.2964772 | -1.3132658 | setosa | 1 |
| 31 | -1.3448073 | 0.0955086 | -1.2385412 | -1.3132658 | setosa | 1 |
| 32 | -0.5681271 | 0.7567220 | -1.2964772 | -1.0485537 | setosa | 1 |
| 33 | -0.8270205 | 2.2995534 | -1.2964772 | -1.4456218 | setosa | 1 |
| 35 | -1.2153606 | 0.0955086 | -1.2964772 | -1.3132658 | setosa | 1 |
| 36 | -1.0859139 | 0.3159131 | -1.4702849 | -1.3132658 | setosa | 1 |
| 37 | -0.4386805 | 0.9771265 | -1.4123490 | -1.3132658 | setosa | 1 |
| 40 | -0.9564672 | 0.7567220 | -1.2964772 | -1.3132658 | setosa | 1 |
| 42 | -1.7331474 | -1.6677272 | -1.4123490 | -1.1809098 | setosa | 1 |
| 44 | -1.0859139 | 0.9771265 | -1.2385412 | -0.7838417 | setosa | 1 |
| 45 | -0.9564672 | 1.6383400 | -1.0647335 | -1.0485537 | setosa | 1 |
| 47 | -0.9564672 | 1.6383400 | -1.2385412 | -1.3132658 | setosa | 1 |
| 50 | -1.0859139 | 0.5363176 | -1.3544131 | -1.3132658 | setosa | 1 |
| 54 | -0.4386805 | -1.6677272 | 0.1519209 | 0.1426504 | versicolor | 2 |
| 55 | 0.8557865 | -0.5657048 | 0.4995364 | 0.4073624 | versicolor | 2 |
| 58 | -1.2153606 | -1.4473227 | -0.2536306 | -0.2544177 | versicolor | 2 |
| 59 | 0.9852331 | -0.3453004 | 0.4995364 | 0.1426504 | versicolor | 2 |
| 60 | -0.8270205 | -0.7861093 | 0.0939849 | 0.2750064 | versicolor | 2 |
| 61 | -1.0859139 | -2.3289407 | -0.1377587 | -0.2544177 | versicolor | 2 |
| 62 | 0.0791063 | -0.1248959 | 0.2677927 | 0.4073624 | versicolor | 2 |
| 63 | 0.2085530 | -1.8881317 | 0.1519209 | -0.2544177 | versicolor | 2 |
| 64 | 0.3379997 | -0.3453004 | 0.5574723 | 0.2750064 | versicolor | 2 |
| 66 | 1.1146798 | 0.0955086 | 0.3836645 | 0.2750064 | versicolor | 2 |
| 67 | -0.3092338 | -0.1248959 | 0.4416005 | 0.4073624 | versicolor | 2 |
| 68 | -0.0503404 | -0.7861093 | 0.2098568 | -0.2544177 | versicolor | 2 |
| 69 | 0.4674464 | -1.8881317 | 0.4416005 | 0.4073624 | versicolor | 2 |
| 70 | -0.3092338 | -1.2269183 | 0.0939849 | -0.1220617 | versicolor | 2 |
| 72 | 0.3379997 | -0.5657048 | 0.1519209 | 0.1426504 | versicolor | 2 |
| 76 | 0.9852331 | -0.1248959 | 0.3836645 | 0.2750064 | versicolor | 2 |
| 77 | 1.2441265 | -0.5657048 | 0.6154082 | 0.2750064 | versicolor | 2 |
| 79 | 0.2085530 | -0.3453004 | 0.4416005 | 0.4073624 | versicolor | 2 |
| 80 | -0.1797871 | -1.0065138 | -0.1377587 | -0.2544177 | versicolor | 2 |
| 81 | -0.4386805 | -1.4473227 | 0.0360490 | -0.1220617 | versicolor | 2 |
| 84 | 0.2085530 | -0.7861093 | 0.7892160 | 0.5397184 | versicolor | 2 |
| 85 | -0.5681271 | -0.1248959 | 0.4416005 | 0.4073624 | versicolor | 2 |
| 86 | 0.2085530 | 0.7567220 | 0.4416005 | 0.5397184 | versicolor | 2 |
| 87 | 1.1146798 | 0.0955086 | 0.5574723 | 0.4073624 | versicolor | 2 |
| 89 | -0.3092338 | -0.1248959 | 0.2098568 | 0.1426504 | versicolor | 2 |
| 90 | -0.4386805 | -1.2269183 | 0.1519209 | 0.1426504 | versicolor | 2 |
| 92 | 0.3379997 | -0.1248959 | 0.4995364 | 0.2750064 | versicolor | 2 |
| 93 | -0.0503404 | -1.0065138 | 0.1519209 | 0.0102944 | versicolor | 2 |
| 96 | -0.1797871 | -0.1248959 | 0.2677927 | 0.0102944 | versicolor | 2 |
| 97 | -0.1797871 | -0.3453004 | 0.2677927 | 0.1426504 | versicolor | 2 |
| 102 | -0.0503404 | -0.7861093 | 0.7892160 | 0.9367864 | virginica | 2 |
| 106 | 2.2797001 | -0.1248959 | 1.6582548 | 1.2014985 | virginica | 2 |
| 107 | -1.2153606 | -1.2269183 | 0.4416005 | 0.6720744 | virginica | 2 |
| 109 | 1.1146798 | -1.2269183 | 1.1947674 | 0.8044304 | virginica | 2 |
| 110 | 1.7619133 | 1.1975310 | 1.3685752 | 1.7309225 | virginica | 2 |
| 111 | 0.8557865 | 0.3159131 | 0.7892160 | 1.0691425 | virginica | 2 |
| 112 | 0.7263398 | -0.7861093 | 0.9050878 | 0.9367864 | virginica | 2 |
| 115 | -0.0503404 | -0.5657048 | 0.7892160 | 1.5985665 | virginica | 2 |
| 116 | 0.7263398 | 0.3159131 | 0.9050878 | 1.4662105 | virginica | 2 |
| 119 | 2.4091467 | -1.0065138 | 1.8320626 | 1.4662105 | virginica | 2 |
| 121 | 1.3735732 | 0.3159131 | 1.1368315 | 1.4662105 | virginica | 2 |
| 124 | 0.5968931 | -0.7861093 | 0.6733441 | 0.8044304 | virginica | 2 |
| 126 | 1.7619133 | 0.3159131 | 1.3106393 | 0.8044304 | virginica | 2 |
| 127 | 0.4674464 | -0.5657048 | 0.6154082 | 0.8044304 | virginica | 2 |
| 128 | 0.3379997 | -0.1248959 | 0.6733441 | 0.8044304 | virginica | 2 |
| 130 | 1.7619133 | -0.1248959 | 1.1947674 | 0.5397184 | virginica | 2 |
| 131 | 2.0208067 | -0.5657048 | 1.3685752 | 0.9367864 | virginica | 2 |
| 132 | 2.6680401 | 1.6383400 | 1.5423830 | 1.0691425 | virginica | 2 |
| 133 | 0.7263398 | -0.5657048 | 1.0788956 | 1.3338545 | virginica | 2 |
| 134 | 0.5968931 | -0.5657048 | 0.7892160 | 0.4073624 | virginica | 2 |
| 135 | 0.3379997 | -1.0065138 | 1.0788956 | 0.2750064 | virginica | 2 |
| 137 | 0.5968931 | 0.7567220 | 1.0788956 | 1.5985665 | virginica | 2 |
| 139 | 0.2085530 | -0.1248959 | 0.6154082 | 0.8044304 | virginica | 2 |
| 143 | -0.0503404 | -0.7861093 | 0.7892160 | 0.9367864 | virginica | 2 |
| 144 | 1.2441265 | 0.3159131 | 1.2527034 | 1.4662105 | virginica | 2 |
| 145 | 1.1146798 | 0.5363176 | 1.1368315 | 1.7309225 | virginica | 2 |
| 146 | 1.1146798 | -0.1248959 | 0.8471519 | 1.4662105 | virginica | 2 |
| 147 | 0.5968931 | -1.2269183 | 0.7312801 | 0.9367864 | virginica | 2 |
| 149 | 0.4674464 | 0.7567220 | 0.9630237 | 1.4662105 | virginica | 2 |
| 150 | 0.0791063 | -0.1248959 | 0.7892160 | 0.8044304 | virginica | 2 |
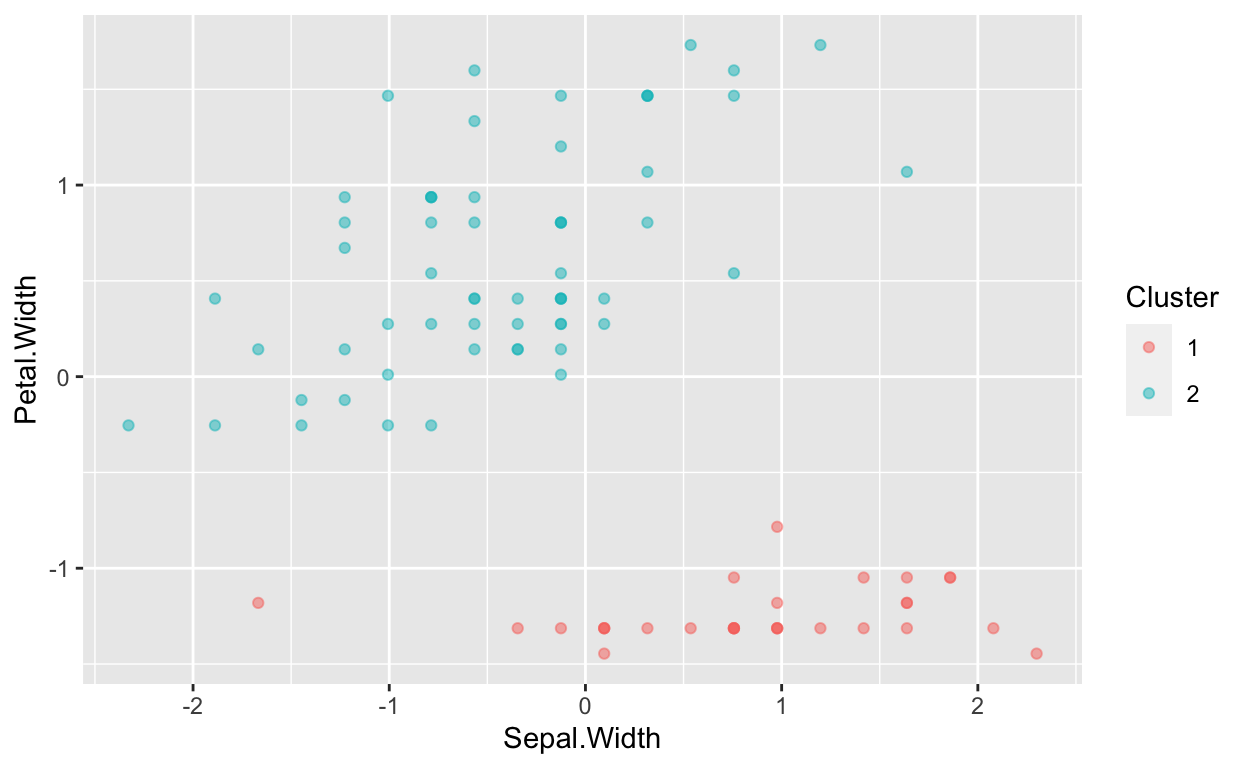
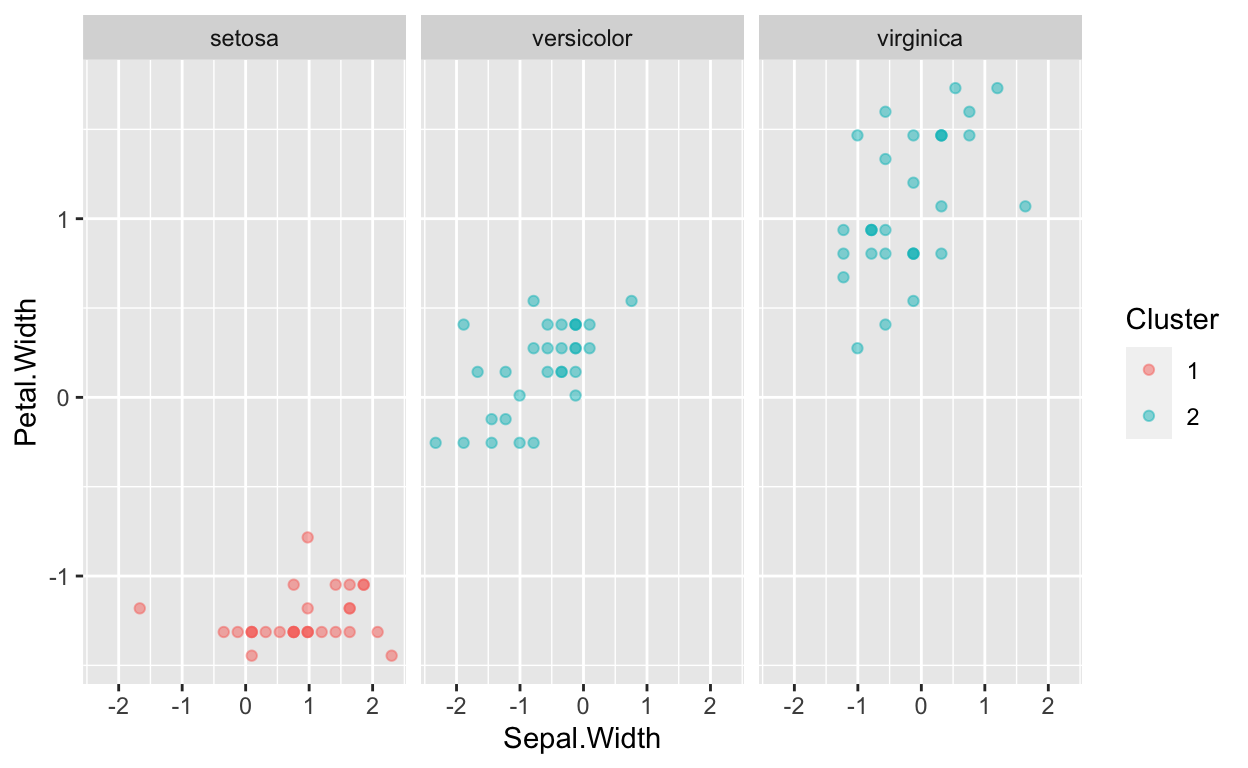
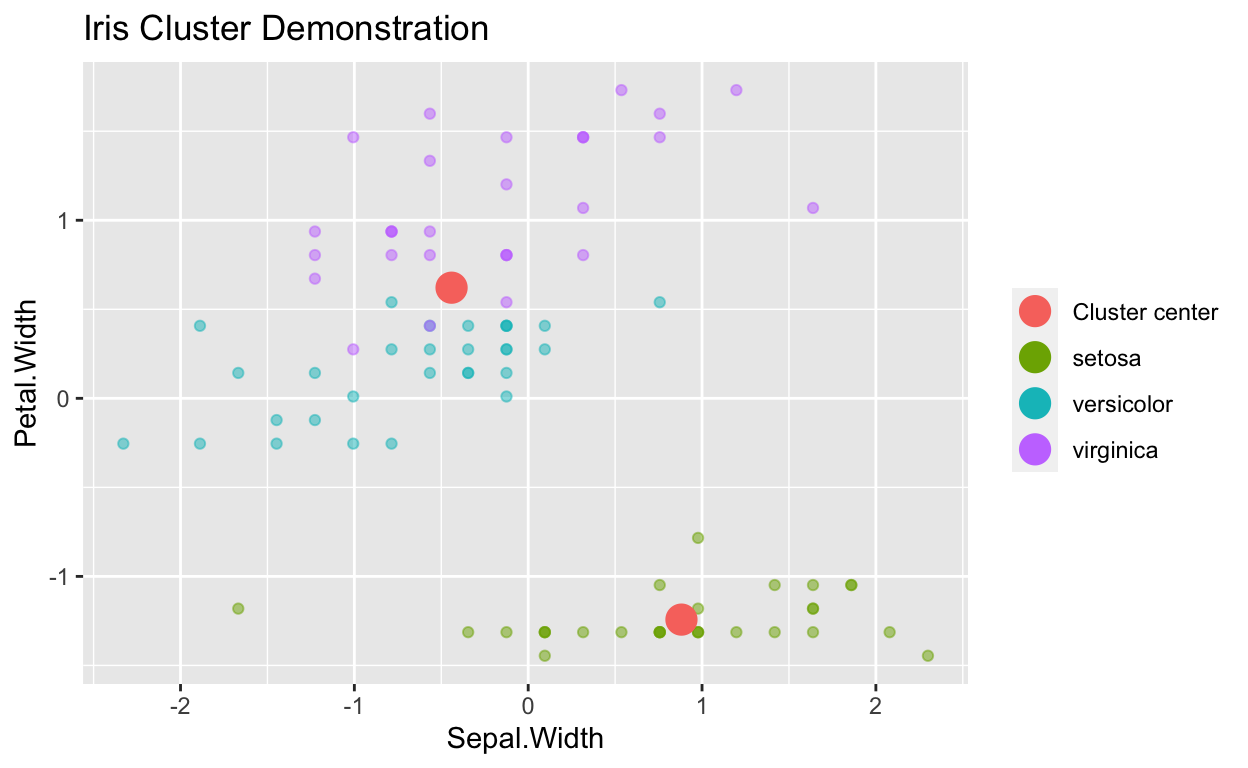
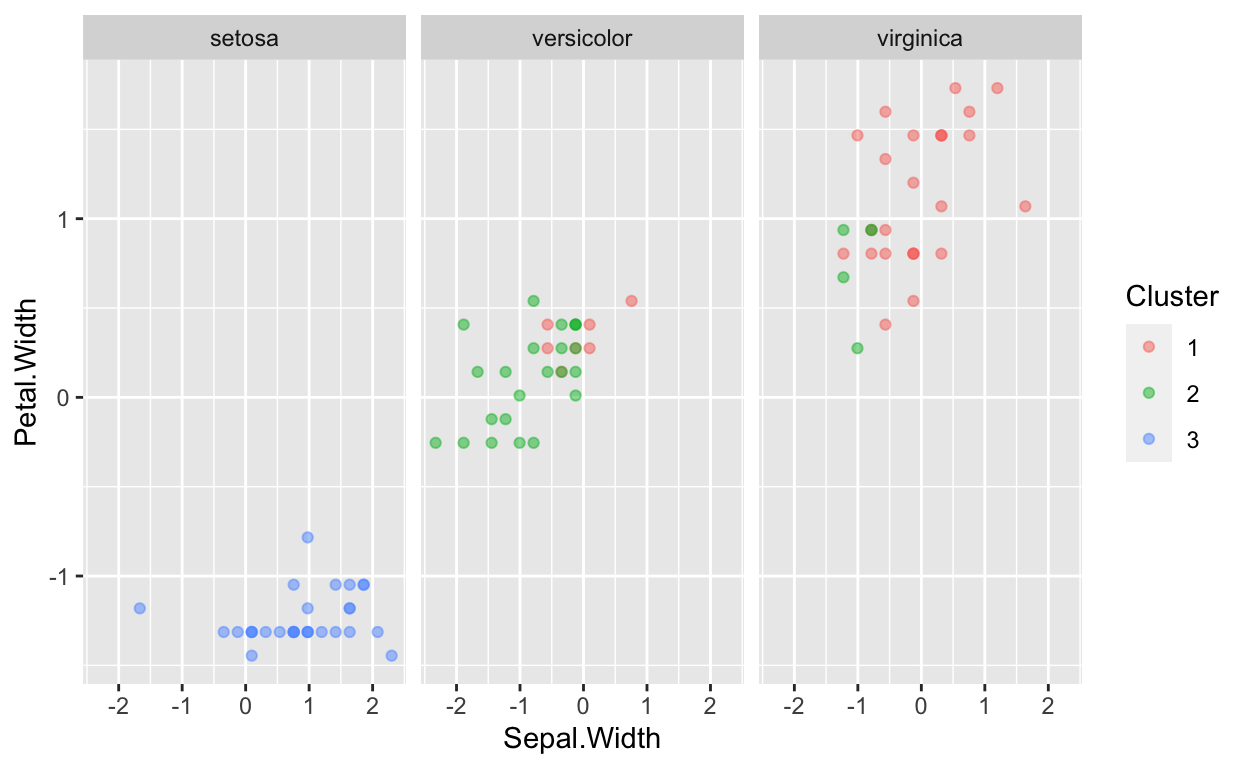
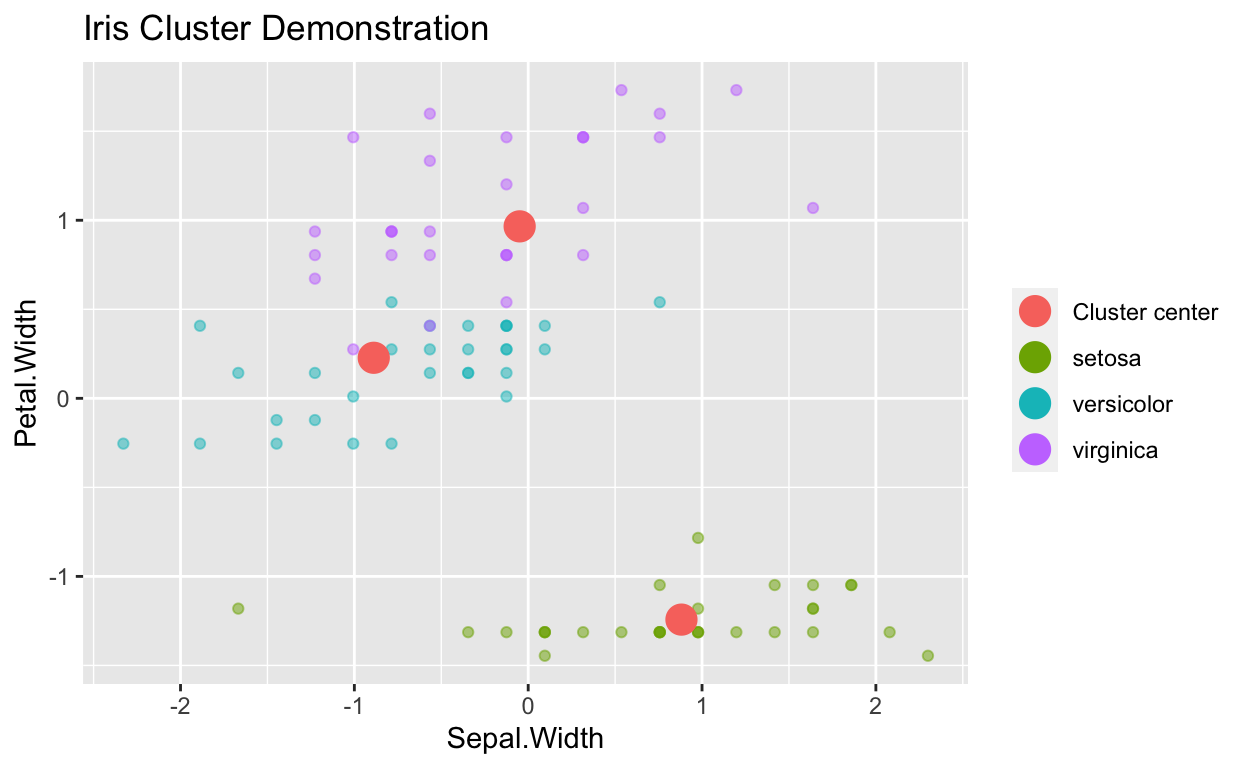
Here are a few graphic representations showing how the data is split when 2 clusters are used. As you can see, it splits one of the species pretty accurately. However, the other 2 do not split well when only two clusters are used.
ggplot(data=Clusterdata,mapping = aes(x=Sepal.Width,y=Petal.Width,color=Cluster))+geom_point(alpha=0.5)
ggplot(data=Clusterdata,mapping = aes(x=Sepal.Width,y=Petal.Width,color=Cluster))+geom_point(alpha=0.5)+facet_wrap(~Species)
ggplot(data=Clusterdata,mapping = aes(x=Sepal.Width,y=Petal.Width,color=Species))+geom_point(alpha=0.5) +
  geom_point(data=as.data.frame(TwoClusters$centers), aes(color="Cluster center"), size=5) + theme(legend.title = element_blank())+ggtitle("Iris Cluster Demonstration")
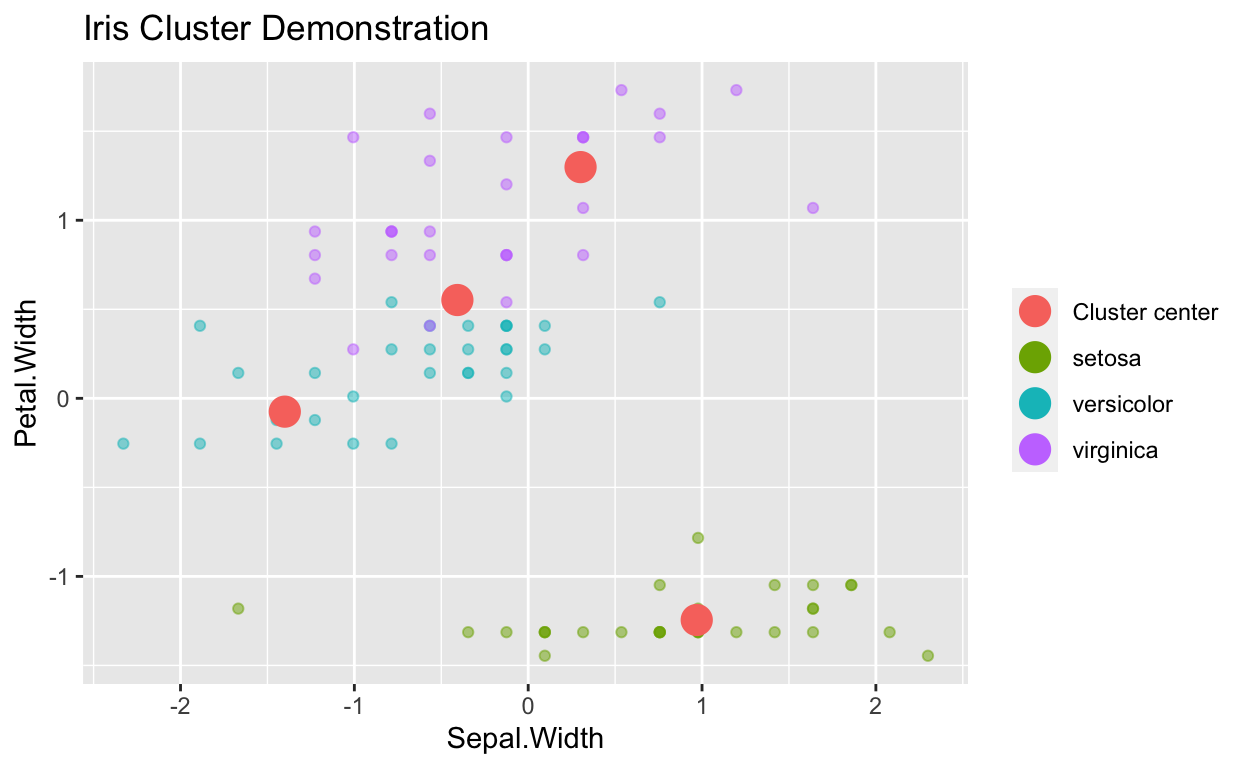
Three Cluster Centers
This is a table of the data when 3 data clusters are used.
ThreeClusters<-kmeans(trainTransformed[,-5],centers=3)
Clusterdata<-trainTransformed
Clusterdata$Cluster<-as.factor(ThreeClusters$cluster)
knitr::kable(Clusterdata)%>%
  kableExtra::kable_styling("striped")%>%
  kableExtra::scroll_box(width = "100%",height="300px")
| Sepal.Length | Sepal.Width | Petal.Length | Petal.Width | Species | Cluster | |
|---|---|---|---|---|---|---|
| 1 | -0.9564672 | 0.9771265 | -1.3544131 | -1.3132658 | setosa | 3 |
| 4 | -1.6037007 | 0.0955086 | -1.2964772 | -1.3132658 | setosa | 3 |
| 5 | -1.0859139 | 1.1975310 | -1.3544131 | -1.3132658 | setosa | 3 |
| 6 | -0.5681271 | 1.8587444 | -1.1806053 | -1.0485537 | setosa | 3 |
| 8 | -1.0859139 | 0.7567220 | -1.2964772 | -1.3132658 | setosa | 3 |
| 9 | -1.8625941 | -0.3453004 | -1.3544131 | -1.3132658 | setosa | 3 |
| 10 | -1.2153606 | 0.0955086 | -1.2964772 | -1.4456218 | setosa | 3 |
| 11 | -0.5681271 | 1.4179355 | -1.2964772 | -1.3132658 | setosa | 3 |
| 12 | -1.3448073 | 0.7567220 | -1.2385412 | -1.3132658 | setosa | 3 |
| 15 | -0.0503404 | 2.0791489 | -1.4702849 | -1.3132658 | setosa | 3 |
| 17 | -0.5681271 | 1.8587444 | -1.4123490 | -1.0485537 | setosa | 3 |
| 18 | -0.9564672 | 0.9771265 | -1.3544131 | -1.1809098 | setosa | 3 |
| 19 | -0.1797871 | 1.6383400 | -1.1806053 | -1.1809098 | setosa | 3 |
| 20 | -0.9564672 | 1.6383400 | -1.2964772 | -1.1809098 | setosa | 3 |
| 21 | -0.5681271 | 0.7567220 | -1.1806053 | -1.3132658 | setosa | 3 |
| 22 | -0.9564672 | 1.4179355 | -1.2964772 | -1.0485537 | setosa | 3 |
| 26 | -1.0859139 | -0.1248959 | -1.2385412 | -1.3132658 | setosa | 3 |
| 28 | -0.8270205 | 0.9771265 | -1.2964772 | -1.3132658 | setosa | 3 |
| 31 | -1.3448073 | 0.0955086 | -1.2385412 | -1.3132658 | setosa | 3 |
| 32 | -0.5681271 | 0.7567220 | -1.2964772 | -1.0485537 | setosa | 3 |
| 33 | -0.8270205 | 2.2995534 | -1.2964772 | -1.4456218 | setosa | 3 |
| 35 | -1.2153606 | 0.0955086 | -1.2964772 | -1.3132658 | setosa | 3 |
| 36 | -1.0859139 | 0.3159131 | -1.4702849 | -1.3132658 | setosa | 3 |
| 37 | -0.4386805 | 0.9771265 | -1.4123490 | -1.3132658 | setosa | 3 |
| 40 | -0.9564672 | 0.7567220 | -1.2964772 | -1.3132658 | setosa | 3 |
| 42 | -1.7331474 | -1.6677272 | -1.4123490 | -1.1809098 | setosa | 3 |
| 44 | -1.0859139 | 0.9771265 | -1.2385412 | -0.7838417 | setosa | 3 |
| 45 | -0.9564672 | 1.6383400 | -1.0647335 | -1.0485537 | setosa | 3 |
| 47 | -0.9564672 | 1.6383400 | -1.2385412 | -1.3132658 | setosa | 3 |
| 50 | -1.0859139 | 0.5363176 | -1.3544131 | -1.3132658 | setosa | 3 |
| 54 | -0.4386805 | -1.6677272 | 0.1519209 | 0.1426504 | versicolor | 2 |
| 55 | 0.8557865 | -0.5657048 | 0.4995364 | 0.4073624 | versicolor | 1 |
| 58 | -1.2153606 | -1.4473227 | -0.2536306 | -0.2544177 | versicolor | 2 |
| 59 | 0.9852331 | -0.3453004 | 0.4995364 | 0.1426504 | versicolor | 1 |
| 60 | -0.8270205 | -0.7861093 | 0.0939849 | 0.2750064 | versicolor | 2 |
| 61 | -1.0859139 | -2.3289407 | -0.1377587 | -0.2544177 | versicolor | 2 |
| 62 | 0.0791063 | -0.1248959 | 0.2677927 | 0.4073624 | versicolor | 2 |
| 63 | 0.2085530 | -1.8881317 | 0.1519209 | -0.2544177 | versicolor | 2 |
| 64 | 0.3379997 | -0.3453004 | 0.5574723 | 0.2750064 | versicolor | 2 |
| 66 | 1.1146798 | 0.0955086 | 0.3836645 | 0.2750064 | versicolor | 1 |
| 67 | -0.3092338 | -0.1248959 | 0.4416005 | 0.4073624 | versicolor | 2 |
| 68 | -0.0503404 | -0.7861093 | 0.2098568 | -0.2544177 | versicolor | 2 |
| 69 | 0.4674464 | -1.8881317 | 0.4416005 | 0.4073624 | versicolor | 2 |
| 70 | -0.3092338 | -1.2269183 | 0.0939849 | -0.1220617 | versicolor | 2 |
| 72 | 0.3379997 | -0.5657048 | 0.1519209 | 0.1426504 | versicolor | 2 |
| 76 | 0.9852331 | -0.1248959 | 0.3836645 | 0.2750064 | versicolor | 1 |
| 77 | 1.2441265 | -0.5657048 | 0.6154082 | 0.2750064 | versicolor | 1 |
| 79 | 0.2085530 | -0.3453004 | 0.4416005 | 0.4073624 | versicolor | 2 |
| 80 | -0.1797871 | -1.0065138 | -0.1377587 | -0.2544177 | versicolor | 2 |
| 81 | -0.4386805 | -1.4473227 | 0.0360490 | -0.1220617 | versicolor | 2 |
| 84 | 0.2085530 | -0.7861093 | 0.7892160 | 0.5397184 | versicolor | 2 |
| 85 | -0.5681271 | -0.1248959 | 0.4416005 | 0.4073624 | versicolor | 2 |
| 86 | 0.2085530 | 0.7567220 | 0.4416005 | 0.5397184 | versicolor | 1 |
| 87 | 1.1146798 | 0.0955086 | 0.5574723 | 0.4073624 | versicolor | 1 |
| 89 | -0.3092338 | -0.1248959 | 0.2098568 | 0.1426504 | versicolor | 2 |
| 90 | -0.4386805 | -1.2269183 | 0.1519209 | 0.1426504 | versicolor | 2 |
| 92 | 0.3379997 | -0.1248959 | 0.4995364 | 0.2750064 | versicolor | 2 |
| 93 | -0.0503404 | -1.0065138 | 0.1519209 | 0.0102944 | versicolor | 2 |
| 96 | -0.1797871 | -0.1248959 | 0.2677927 | 0.0102944 | versicolor | 2 |
| 97 | -0.1797871 | -0.3453004 | 0.2677927 | 0.1426504 | versicolor | 2 |
| 102 | -0.0503404 | -0.7861093 | 0.7892160 | 0.9367864 | virginica | 2 |
| 106 | 2.2797001 | -0.1248959 | 1.6582548 | 1.2014985 | virginica | 1 |
| 107 | -1.2153606 | -1.2269183 | 0.4416005 | 0.6720744 | virginica | 2 |
| 109 | 1.1146798 | -1.2269183 | 1.1947674 | 0.8044304 | virginica | 1 |
| 110 | 1.7619133 | 1.1975310 | 1.3685752 | 1.7309225 | virginica | 1 |
| 111 | 0.8557865 | 0.3159131 | 0.7892160 | 1.0691425 | virginica | 1 |
| 112 | 0.7263398 | -0.7861093 | 0.9050878 | 0.9367864 | virginica | 1 |
| 115 | -0.0503404 | -0.5657048 | 0.7892160 | 1.5985665 | virginica | 1 |
| 116 | 0.7263398 | 0.3159131 | 0.9050878 | 1.4662105 | virginica | 1 |
| 119 | 2.4091467 | -1.0065138 | 1.8320626 | 1.4662105 | virginica | 1 |
| 121 | 1.3735732 | 0.3159131 | 1.1368315 | 1.4662105 | virginica | 1 |
| 124 | 0.5968931 | -0.7861093 | 0.6733441 | 0.8044304 | virginica | 1 |
| 126 | 1.7619133 | 0.3159131 | 1.3106393 | 0.8044304 | virginica | 1 |
| 127 | 0.4674464 | -0.5657048 | 0.6154082 | 0.8044304 | virginica | 1 |
| 128 | 0.3379997 | -0.1248959 | 0.6733441 | 0.8044304 | virginica | 1 |
| 130 | 1.7619133 | -0.1248959 | 1.1947674 | 0.5397184 | virginica | 1 |
| 131 | 2.0208067 | -0.5657048 | 1.3685752 | 0.9367864 | virginica | 1 |
| 132 | 2.6680401 | 1.6383400 | 1.5423830 | 1.0691425 | virginica | 1 |
| 133 | 0.7263398 | -0.5657048 | 1.0788956 | 1.3338545 | virginica | 1 |
| 134 | 0.5968931 | -0.5657048 | 0.7892160 | 0.4073624 | virginica | 1 |
| 135 | 0.3379997 | -1.0065138 | 1.0788956 | 0.2750064 | virginica | 2 |
| 137 | 0.5968931 | 0.7567220 | 1.0788956 | 1.5985665 | virginica | 1 |
| 139 | 0.2085530 | -0.1248959 | 0.6154082 | 0.8044304 | virginica | 1 |
| 143 | -0.0503404 | -0.7861093 | 0.7892160 | 0.9367864 | virginica | 2 |
| 144 | 1.2441265 | 0.3159131 | 1.2527034 | 1.4662105 | virginica | 1 |
| 145 | 1.1146798 | 0.5363176 | 1.1368315 | 1.7309225 | virginica | 1 |
| 146 | 1.1146798 | -0.1248959 | 0.8471519 | 1.4662105 | virginica | 1 |
| 147 | 0.5968931 | -1.2269183 | 0.7312801 | 0.9367864 | virginica | 2 |
| 149 | 0.4674464 | 0.7567220 | 0.9630237 | 1.4662105 | virginica | 1 |
| 150 | 0.0791063 | -0.1248959 | 0.7892160 | 0.8044304 | virginica | 1 |
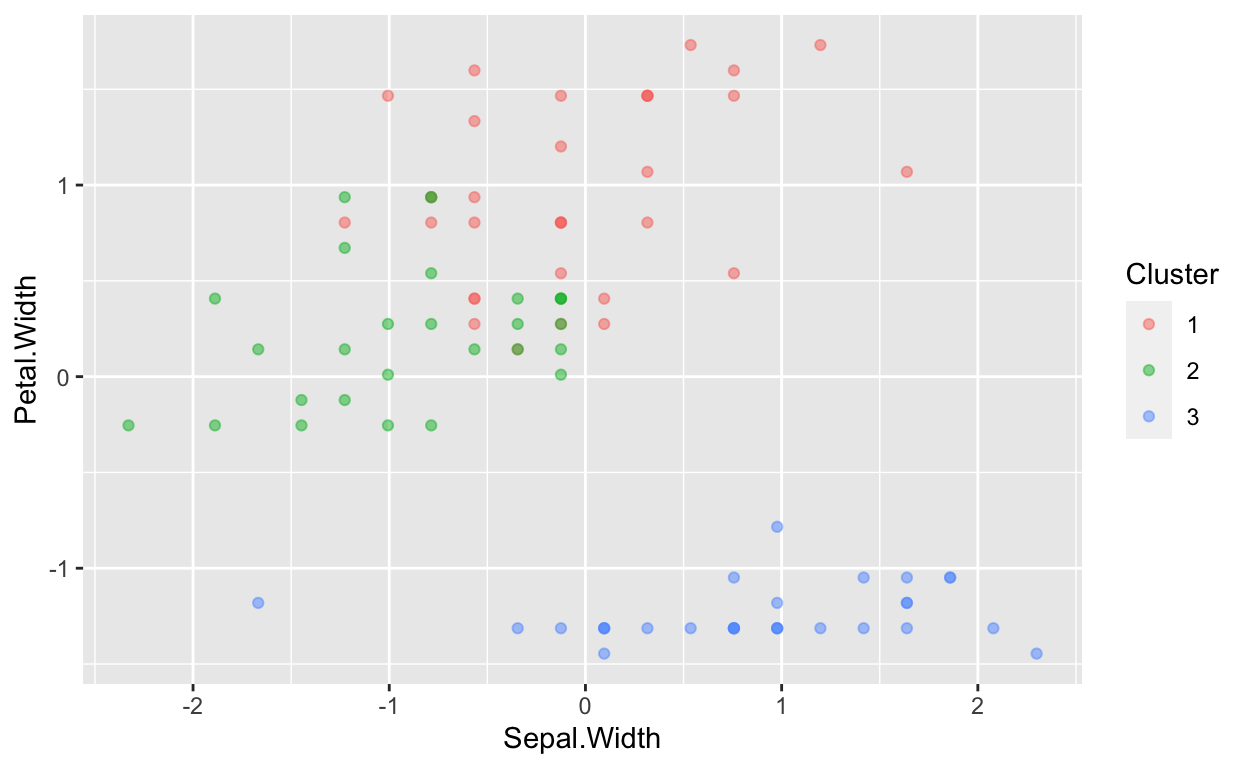
These graphs show how the data is split when 3 clusters are used rather than 2. As you can see, using 3 centers allows for a more accurate split of the data.
ggplot(data=Clusterdata,mapping = aes(x=Sepal.Width,y=Petal.Width,color=Cluster))+geom_point(alpha=0.5)
ggplot(data=Clusterdata,mapping = aes(x=Sepal.Width,y=Petal.Width,color=Cluster))+geom_point(alpha=0.5)+facet_wrap(~Species)
ggplot(data=Clusterdata,mapping = aes(x=Sepal.Width,y=Petal.Width,color=Species))+geom_point(alpha=0.5) +
  geom_point(data=as.data.frame(ThreeClusters$centers), aes(color="Cluster center"), size=5) + theme(legend.title = element_blank())+ggtitle("Iris Cluster Demonstration")
Four Cluster Centers
And lastly, here is a table form of the data when 4 clusters are used.
FourClusters<-kmeans(trainTransformed[,-5],centers=4)
Clusterdata<-trainTransformed
Clusterdata$Cluster<-as.factor(FourClusters$cluster)
knitr::kable(Clusterdata)%>%
  kableExtra::kable_styling("striped")%>%
  kableExtra::scroll_box(width = "100%",height="300px")
| Sepal.Length | Sepal.Width | Petal.Length | Petal.Width | Species | Cluster | |
|---|---|---|---|---|---|---|
| 1 | -0.9564672 | 0.9771265 | -1.3544131 | -1.3132658 | setosa | 4 |
| 4 | -1.6037007 | 0.0955086 | -1.2964772 | -1.3132658 | setosa | 4 |
| 5 | -1.0859139 | 1.1975310 | -1.3544131 | -1.3132658 | setosa | 4 |
| 6 | -0.5681271 | 1.8587444 | -1.1806053 | -1.0485537 | setosa | 4 |
| 8 | -1.0859139 | 0.7567220 | -1.2964772 | -1.3132658 | setosa | 4 |
| 9 | -1.8625941 | -0.3453004 | -1.3544131 | -1.3132658 | setosa | 4 |
| 10 | -1.2153606 | 0.0955086 | -1.2964772 | -1.4456218 | setosa | 4 |
| 11 | -0.5681271 | 1.4179355 | -1.2964772 | -1.3132658 | setosa | 4 |
| 12 | -1.3448073 | 0.7567220 | -1.2385412 | -1.3132658 | setosa | 4 |
| 15 | -0.0503404 | 2.0791489 | -1.4702849 | -1.3132658 | setosa | 4 |
| 17 | -0.5681271 | 1.8587444 | -1.4123490 | -1.0485537 | setosa | 4 |
| 18 | -0.9564672 | 0.9771265 | -1.3544131 | -1.1809098 | setosa | 4 |
| 19 | -0.1797871 | 1.6383400 | -1.1806053 | -1.1809098 | setosa | 4 |
| 20 | -0.9564672 | 1.6383400 | -1.2964772 | -1.1809098 | setosa | 4 |
| 21 | -0.5681271 | 0.7567220 | -1.1806053 | -1.3132658 | setosa | 4 |
| 22 | -0.9564672 | 1.4179355 | -1.2964772 | -1.0485537 | setosa | 4 |
| 26 | -1.0859139 | -0.1248959 | -1.2385412 | -1.3132658 | setosa | 4 |
| 28 | -0.8270205 | 0.9771265 | -1.2964772 | -1.3132658 | setosa | 4 |
| 31 | -1.3448073 | 0.0955086 | -1.2385412 | -1.3132658 | setosa | 4 |
| 32 | -0.5681271 | 0.7567220 | -1.2964772 | -1.0485537 | setosa | 4 |
| 33 | -0.8270205 | 2.2995534 | -1.2964772 | -1.4456218 | setosa | 4 |
| 35 | -1.2153606 | 0.0955086 | -1.2964772 | -1.3132658 | setosa | 4 |
| 36 | -1.0859139 | 0.3159131 | -1.4702849 | -1.3132658 | setosa | 4 |
| 37 | -0.4386805 | 0.9771265 | -1.4123490 | -1.3132658 | setosa | 4 |
| 40 | -0.9564672 | 0.7567220 | -1.2964772 | -1.3132658 | setosa | 4 |
| 42 | -1.7331474 | -1.6677272 | -1.4123490 | -1.1809098 | setosa | 2 |
| 44 | -1.0859139 | 0.9771265 | -1.2385412 | -0.7838417 | setosa | 4 |
| 45 | -0.9564672 | 1.6383400 | -1.0647335 | -1.0485537 | setosa | 4 |
| 47 | -0.9564672 | 1.6383400 | -1.2385412 | -1.3132658 | setosa | 4 |
| 50 | -1.0859139 | 0.5363176 | -1.3544131 | -1.3132658 | setosa | 4 |
| 54 | -0.4386805 | -1.6677272 | 0.1519209 | 0.1426504 | versicolor | 2 |
| 55 | 0.8557865 | -0.5657048 | 0.4995364 | 0.4073624 | versicolor | 1 |
| 58 | -1.2153606 | -1.4473227 | -0.2536306 | -0.2544177 | versicolor | 2 |
| 59 | 0.9852331 | -0.3453004 | 0.4995364 | 0.1426504 | versicolor | 1 |
| 60 | -0.8270205 | -0.7861093 | 0.0939849 | 0.2750064 | versicolor | 2 |
| 61 | -1.0859139 | -2.3289407 | -0.1377587 | -0.2544177 | versicolor | 2 |
| 62 | 0.0791063 | -0.1248959 | 0.2677927 | 0.4073624 | versicolor | 1 |
| 63 | 0.2085530 | -1.8881317 | 0.1519209 | -0.2544177 | versicolor | 2 |
| 64 | 0.3379997 | -0.3453004 | 0.5574723 | 0.2750064 | versicolor | 1 |
| 66 | 1.1146798 | 0.0955086 | 0.3836645 | 0.2750064 | versicolor | 1 |
| 67 | -0.3092338 | -0.1248959 | 0.4416005 | 0.4073624 | versicolor | 1 |
| 68 | -0.0503404 | -0.7861093 | 0.2098568 | -0.2544177 | versicolor | 2 |
| 69 | 0.4674464 | -1.8881317 | 0.4416005 | 0.4073624 | versicolor | 2 |
| 70 | -0.3092338 | -1.2269183 | 0.0939849 | -0.1220617 | versicolor | 2 |
| 72 | 0.3379997 | -0.5657048 | 0.1519209 | 0.1426504 | versicolor | 1 |
| 76 | 0.9852331 | -0.1248959 | 0.3836645 | 0.2750064 | versicolor | 1 |
| 77 | 1.2441265 | -0.5657048 | 0.6154082 | 0.2750064 | versicolor | 1 |
| 79 | 0.2085530 | -0.3453004 | 0.4416005 | 0.4073624 | versicolor | 1 |
| 80 | -0.1797871 | -1.0065138 | -0.1377587 | -0.2544177 | versicolor | 2 |
| 81 | -0.4386805 | -1.4473227 | 0.0360490 | -0.1220617 | versicolor | 2 |
| 84 | 0.2085530 | -0.7861093 | 0.7892160 | 0.5397184 | versicolor | 1 |
| 85 | -0.5681271 | -0.1248959 | 0.4416005 | 0.4073624 | versicolor | 1 |
| 86 | 0.2085530 | 0.7567220 | 0.4416005 | 0.5397184 | versicolor | 1 |
| 87 | 1.1146798 | 0.0955086 | 0.5574723 | 0.4073624 | versicolor | 1 |
| 89 | -0.3092338 | -0.1248959 | 0.2098568 | 0.1426504 | versicolor | 1 |
| 90 | -0.4386805 | -1.2269183 | 0.1519209 | 0.1426504 | versicolor | 2 |
| 92 | 0.3379997 | -0.1248959 | 0.4995364 | 0.2750064 | versicolor | 1 |
| 93 | -0.0503404 | -1.0065138 | 0.1519209 | 0.0102944 | versicolor | 2 |
| 96 | -0.1797871 | -0.1248959 | 0.2677927 | 0.0102944 | versicolor | 1 |
| 97 | -0.1797871 | -0.3453004 | 0.2677927 | 0.1426504 | versicolor | 1 |
| 102 | -0.0503404 | -0.7861093 | 0.7892160 | 0.9367864 | virginica | 1 |
| 106 | 2.2797001 | -0.1248959 | 1.6582548 | 1.2014985 | virginica | 3 |
| 107 | -1.2153606 | -1.2269183 | 0.4416005 | 0.6720744 | virginica | 2 |
| 109 | 1.1146798 | -1.2269183 | 1.1947674 | 0.8044304 | virginica | 1 |
| 110 | 1.7619133 | 1.1975310 | 1.3685752 | 1.7309225 | virginica | 3 |
| 111 | 0.8557865 | 0.3159131 | 0.7892160 | 1.0691425 | virginica | 3 |
| 112 | 0.7263398 | -0.7861093 | 0.9050878 | 0.9367864 | virginica | 1 |
| 115 | -0.0503404 | -0.5657048 | 0.7892160 | 1.5985665 | virginica | 1 |
| 116 | 0.7263398 | 0.3159131 | 0.9050878 | 1.4662105 | virginica | 3 |
| 119 | 2.4091467 | -1.0065138 | 1.8320626 | 1.4662105 | virginica | 3 |
| 121 | 1.3735732 | 0.3159131 | 1.1368315 | 1.4662105 | virginica | 3 |
| 124 | 0.5968931 | -0.7861093 | 0.6733441 | 0.8044304 | virginica | 1 |
| 126 | 1.7619133 | 0.3159131 | 1.3106393 | 0.8044304 | virginica | 3 |
| 127 | 0.4674464 | -0.5657048 | 0.6154082 | 0.8044304 | virginica | 1 |
| 128 | 0.3379997 | -0.1248959 | 0.6733441 | 0.8044304 | virginica | 1 |
| 130 | 1.7619133 | -0.1248959 | 1.1947674 | 0.5397184 | virginica | 3 |
| 131 | 2.0208067 | -0.5657048 | 1.3685752 | 0.9367864 | virginica | 3 |
| 132 | 2.6680401 | 1.6383400 | 1.5423830 | 1.0691425 | virginica | 3 |
| 133 | 0.7263398 | -0.5657048 | 1.0788956 | 1.3338545 | virginica | 1 |
| 134 | 0.5968931 | -0.5657048 | 0.7892160 | 0.4073624 | virginica | 1 |
| 135 | 0.3379997 | -1.0065138 | 1.0788956 | 0.2750064 | virginica | 1 |
| 137 | 0.5968931 | 0.7567220 | 1.0788956 | 1.5985665 | virginica | 3 |
| 139 | 0.2085530 | -0.1248959 | 0.6154082 | 0.8044304 | virginica | 1 |
| 143 | -0.0503404 | -0.7861093 | 0.7892160 | 0.9367864 | virginica | 1 |
| 144 | 1.2441265 | 0.3159131 | 1.2527034 | 1.4662105 | virginica | 3 |
| 145 | 1.1146798 | 0.5363176 | 1.1368315 | 1.7309225 | virginica | 3 |
| 146 | 1.1146798 | -0.1248959 | 0.8471519 | 1.4662105 | virginica | 3 |
| 147 | 0.5968931 | -1.2269183 | 0.7312801 | 0.9367864 | virginica | 1 |
| 149 | 0.4674464 | 0.7567220 | 0.9630237 | 1.4662105 | virginica | 3 |
| 150 | 0.0791063 | -0.1248959 | 0.7892160 | 0.8044304 | virginica | 1 |
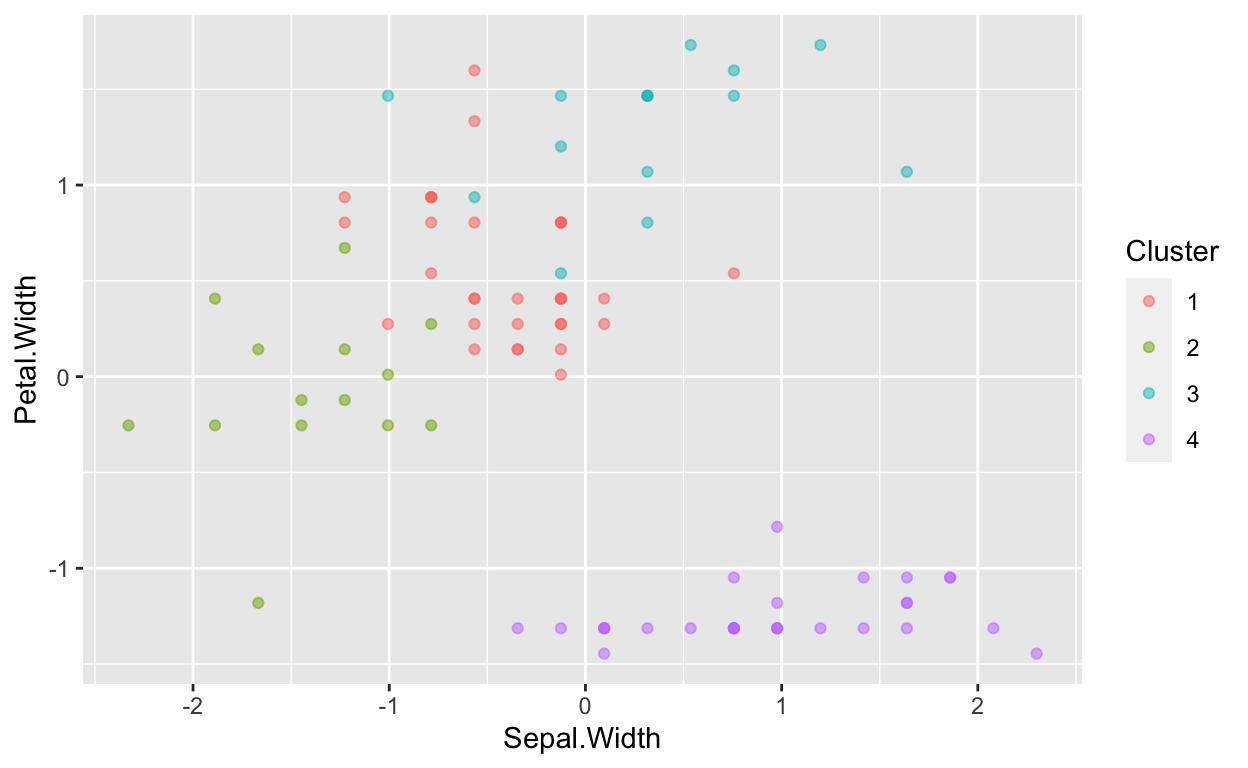
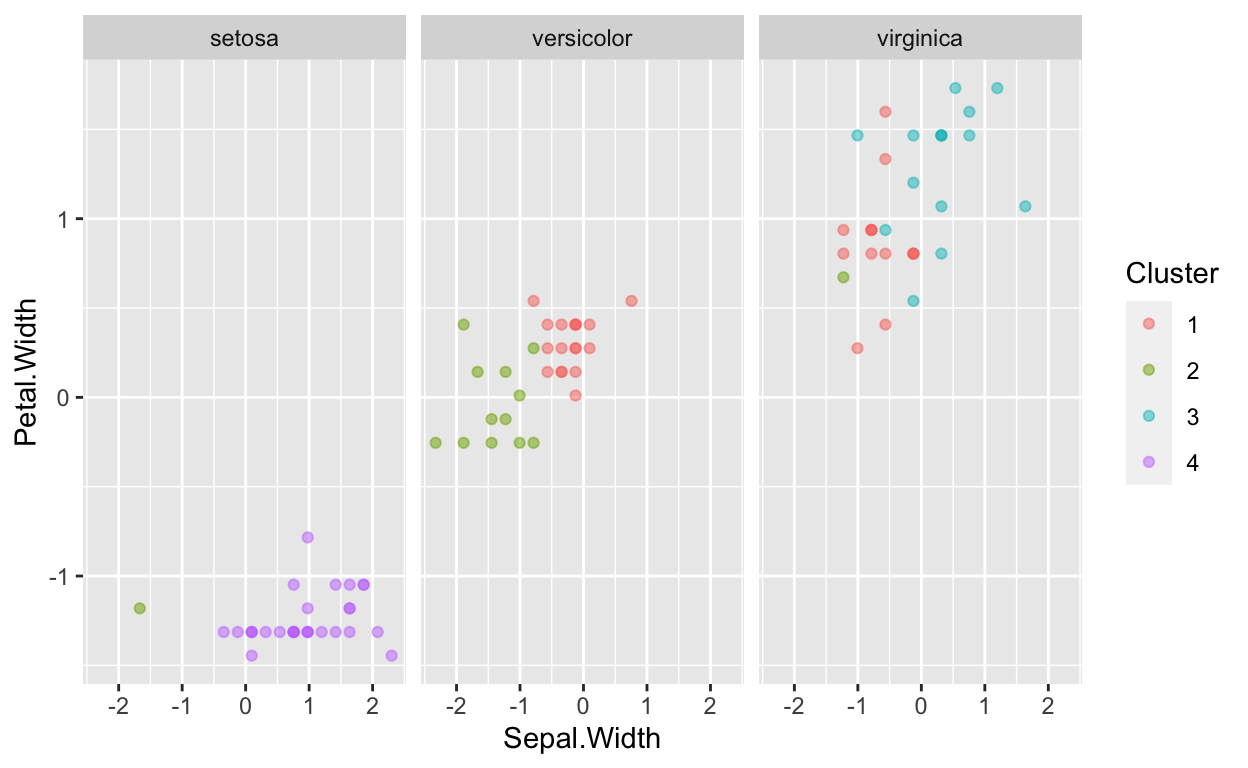
Here are some visual representations of what the data would look like when split between 4 cluster centers. Because there are only 3 species, 4 cluster centers does not prove to be extra beneficial.
ggplot(data=Clusterdata,mapping = aes(x=Sepal.Width,y=Petal.Width,color=Cluster))+geom_point(alpha=0.5)
ggplot(data=Clusterdata,mapping = aes(x=Sepal.Width,y=Petal.Width,color=Cluster))+geom_point(alpha=0.5)+facet_wrap(~Species)
ggplot(data=Clusterdata,mapping = aes(x=Sepal.Width,y=Petal.Width,color=Species))+geom_point(alpha=0.5) +
  geom_point(data=as.data.frame(FourClusters$centers), aes(color="Cluster center"), size=5) + theme(legend.title = element_blank())+ggtitle("Iris Cluster Demonstration")
Clustering in the Real World
I have demonstrated how clustering can be used in machine learning, but what are some ways that this can be used in the real world? There are many scenarios when clustering could be beneficial. It is often used in marketing to identify households or individuals who are similar to each other to better understand how they need to market certain products to them. The same goes for streaming services. Businesses like Netflix and Hulu use clustering to identify subscribers who tend to watch similar shows or movies so they can provide better recommendations to them. It can also be used in the insurance industry. Insurance providers can identify households who are in the same cluster to see how similar they are based on how they use their insurance throughout the year. The insurance company can then set monthly premiums for a whole group based on their similar actions. Clustering also proves to be beneficial to the profession of accounting. Specifically, it can be used in auditing to identify outliers. This allows auditors to examine those numbers more closely and see what they are so high/low.